
Should You Buy or Sell Now in the Bay Area? 2025 Market Trends Explained
- Judy Sin
- Aug 28, 2025
- 6 min read

Updated: Jun 8
The most common question I hear right now is simple but loaded: “Should I buy or sell now—or wait?” If you’ve been following the headlines, you’ve probably seen conflicting messages about interest rates, tariffs, jobs, and housing prices. No wonder so many people feel stuck.
To cut through the noise, let’s look at the latest data from both the Bay Area housing market and the broader U.S. economy. These charts give us a clear picture of what’s happening—and what it means for your decision in 2025.
The Big Picture: Bay Area Home Sales
In the first half of 2025, Bay Area home sales increased about 2.4% year over year by dollar volume. The year started strong, with Q1 posting solid gains compared to 2024. Q2, however, softened as economic volatility and rising uncertainty slowed momentum. What this means for buyers and sellers is that while activity continues, the market feels more cautious. Homes are still selling, but buyers are taking more time to evaluate, and sellers are finding they must position their properties carefully to get noticed.

Financial Markets: Volatility and Its Impact
The stock market has been turbulent this year, with significant swings following new tariff announcements. For real estate, this matters because financial markets directly affect buyer psychology. When the market feels strong, buyers—especially those with stock-heavy portfolios—are more confident about making major purchases. But volatility has the opposite effect, leading many to wait on the sidelines until conditions feel more stable.

Mortgage Rates: Signs of Relief
Mortgage rates, one of the biggest drivers of affordability, have been moving with each new economic announcement. In early August 2025, average 30-year conforming rates hovered around 6.72%, and on some days dropped even further. Freddie Mac’s weekly averages confirm the trend, though they lag behind the daily fluctuations. The key point is this: small shifts in mortgage rates have a big impact on monthly payments. For buyers, even a modest dip can open new possibilities.


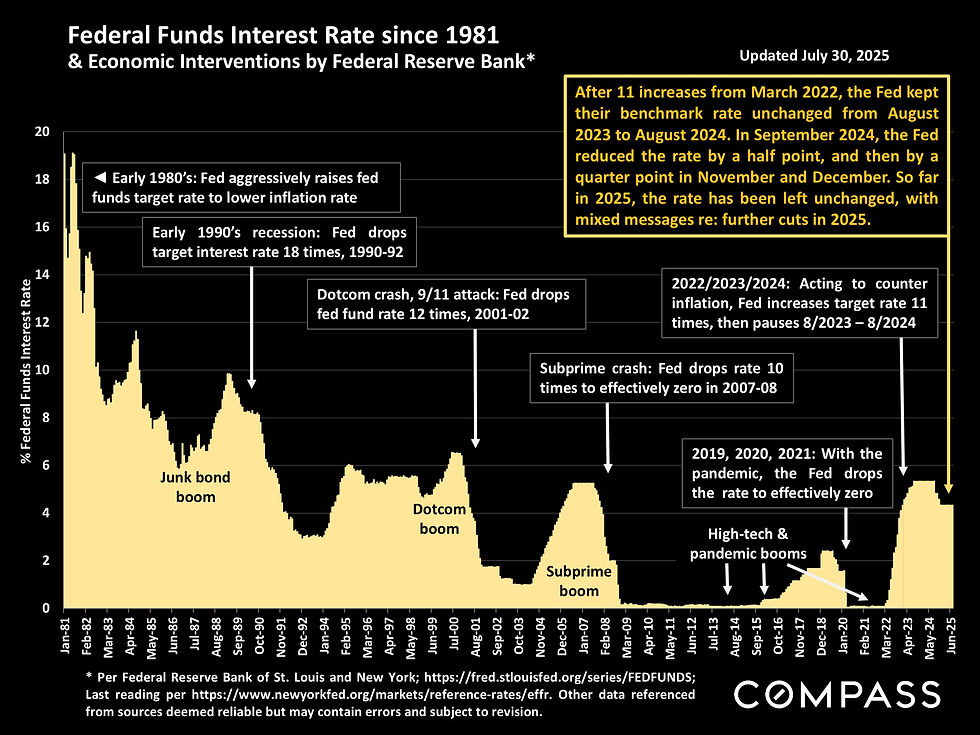
Fed Policy: The Key Player
The Federal Reserve has held its benchmark rate steady this year, but the most recent jobs report has many analysts predicting cuts ahead. For the first time in decades, two Fed board members even dissented, saying they believed a rate reduction was already warranted. If cuts do come, they could trigger a wave of renewed buyer activity, since lower borrowing costs almost always translate to greater demand.
Economic Uncertainty
The Economic Policy Uncertainty Index spiked to historic highs in April 2025 before easing slightly in recent months. While the worst of the spike is behind us, the index remains well above normal levels. Elevated uncertainty keeps both consumers and investors cautious, delaying big decisions. For housing, this means some buyers and sellers remain hesitant, waiting for a clearer picture before acting.

GDP, Jobs, and Consumer Confidence
The U.S. economy recorded a decline in the first quarter of 2025 but bounced back in the second quarter, though economists caution that tariff distortions may have exaggerated the rebound. The jobs market, meanwhile, tells a more concerning story. Initial reports for May and June suggested solid job creation, but revisions showed growth was far weaker than believed. July’s report looked stronger, but given the recent pattern, many are taking a wait-and-see approach.
Consumer sentiment, measured by the University of Michigan, has improved slightly for two months in a row, but remains broadly negative. Stockholders reported rising confidence, while non-stockholders remained wary. Inflation expectations are falling, which is good news, but overall optimism about the economy is still limited. Taken together, these measures suggest a mixed picture: some encouraging signs, but not enough to erase broader concerns.


Local Market Dynamics: Supply Rising
Seasonal trends are playing out in the Bay Area. New listings typically peak in spring before declining in summer, and this year was no different. However, compared to last year, the number of new homes listed in July was lower. At the same time, active listings—the total number of homes on the market—rose 23% year over year. This means that while fewer homes are being added to the market now, the homes already listed are staying available longer. For buyers, that translates to more choice. For sellers, it means more competition.


Buyer Demand Weakening
The pending-sale ratio, which measures how many homes are going into contract relative to supply, has slipped both month over month and year over year. The decline signals that demand is not keeping up with the increase in inventory. Put simply, buyers are not snapping up homes as quickly as they did in the past, which tips the balance slightly in favor of buyers.

Sellers Are Adjusting Prices
In July 2025, the number of price reductions declined compared to June, but it was still the highest July reading since 2022, when interest rates spiked. This shows that sellers are recognizing the shift in buyer behavior and adjusting their pricing strategies to stay competitive. Price cuts are often a sign of motivated sellers in a market where buyers are taking their time and negotiating harder.

Tariffs and Their Ripple Effect
One of the wild cards in today’s economy is tariff policy. Since April, tariff revenues have surged to over $30 billion a month, compared to a long-term average of $6 to $8 billion. The jump has fed into market volatility, consumer prices, and expectations for Federal Reserve policy. For housing, the ripple effect is clear: tariffs add another layer of uncertainty to an already complex market.

So, Should You Buy or Sell Now?
For Buyers
The data shows that buyers are in a stronger position than they’ve been in recent years. More homes are on the market, properties are staying available longer, and many sellers are adjusting prices to attract offers. At the same time, interest rates have shown signs of easing, and if the Federal Reserve lowers rates later this year, affordability could improve further. This creates an environment where buyers can take their time, explore more options, and negotiate more confidently than during the ultra-competitive market of 2021–2022.
For Sellers
Homes are still selling in today’s market, but not at the breakneck pace we saw in previous years. Buyers are cautious, and they have more choices. That means sellers need to be strategic. Proper pricing is more critical than ever, and presentation—through professional staging, marketing, and positioning—makes all the difference. Sellers who adapt quickly are the ones seeing successful results, while overpriced listings risk sitting on the market and facing price reductions later.
Outlook
Looking ahead, volatility will likely remain part of the picture. Tariffs, jobs reports, and inflation data continue to move the markets and shape interest rates. If mortgage rates decline, demand could strengthen quickly, giving sellers more activity to work with and buyers an incentive to move fast. Long-term, the Bay Area remains one of the most resilient housing markets in the country, thanks to its strong job base, excellent schools, and quality of life.
Final Thought
There’s no single answer to whether you should buy or sell now. What matters most is how the market intersects with your personal goals. The data shows both challenges and opportunities, but with the right guidance, it is possible to make a smart move in 2025.
If you’re considering a transition, let’s connect. I’ll help you understand how today’s trends affect your situation, so you can make your decision with clarity and confidence.
Ready to talk through your situation with someone who knows this market?
See what Judy's buyers have achieved and imagine what's possible for you.


Comments